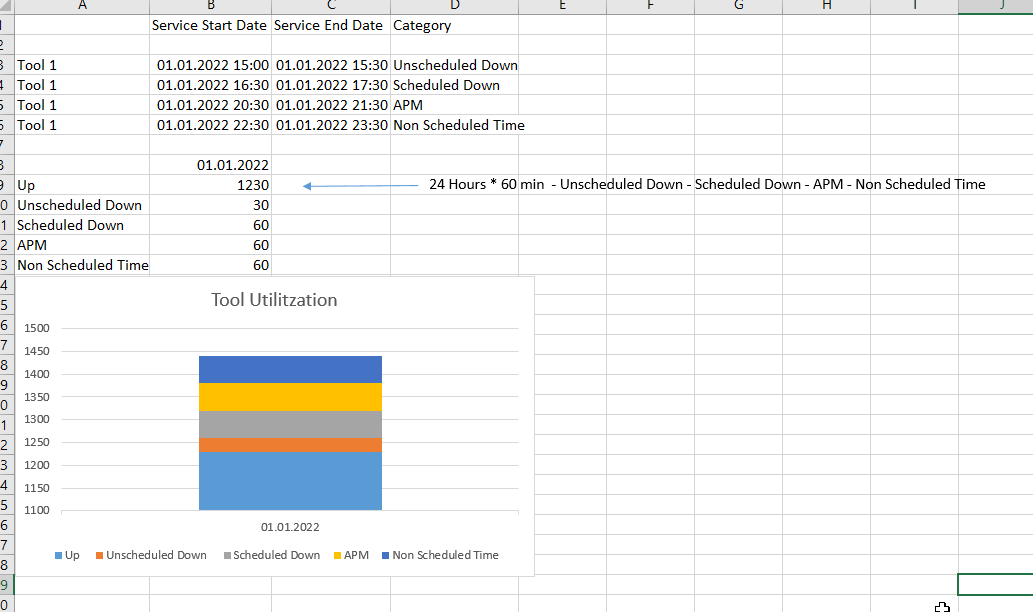
Do I understand this correctly? You have a custom data source with details about tool downtimes, either scheduled or unscheduled.
In this case, you might need to build a new custom cube.
eazyBI might not import well data from the current file structure:
Tool, Service Start, Service End, Category
You would like to import the duration (Service end - service start) mapped by service start or end date. The simplest way would be importing duration time instead of calculating it in eazyBI.
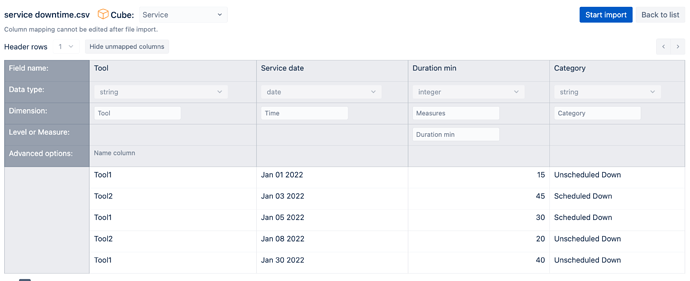
I would suggest preparing the source in this structure:
Tool, Service date, Duration, Category
In the mapping, I defined a new cube Service. Type in the name of the cube to create a new one. Then I mapped columns:
Tool with data type String, dimension with name Tool, and set the name column
Service date with data type Date to dimension Time
Duration min with data type integer as Measures with a name Duration min
Category with data type String as a dimension with the name Category.
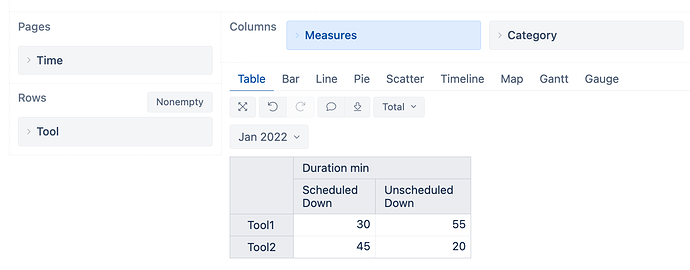
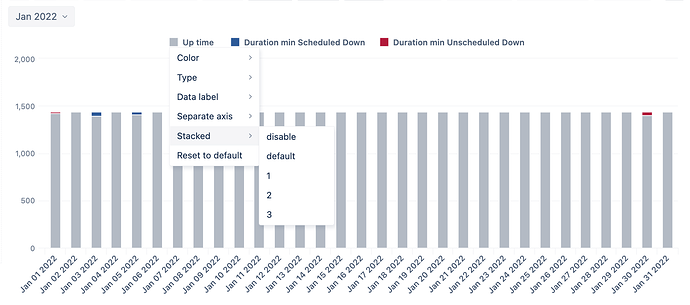
Then I run the import and could create this report from import data directly:
In this setup, we are importing the service down times only. Therefore, we need to calculate the up time in minutes based on 24x60 per day.
(
  -- make it general - calculate days in periods:
  DateDiffDays(
    [Time].CurrentHierarchyMember.StartDate,
    [Time].CurrentHierarchyMember.NextStartDate
  )
  *
  -- total time per day
  24 * 60
)
-
-- subtract all downtime
([Measures].[Duration min], [Category].DefaultMember)
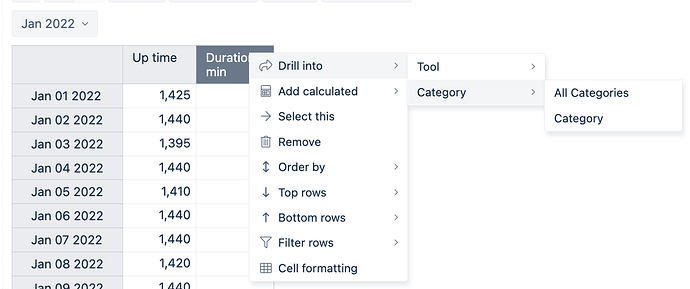
Add the Up time measure to the report. Then click on the Downtime min measure and split it by category with the option Drill into Category.
Then switch to the Bar chart. Make it Vertical, Stacked. By default, Up time will be in a separate stack. Please set the option Stacked the same, for example, 1 for each metric in the report.
Daina / support@eazybi.com
