I’ve been working the last days on trying to ‘extend’ the template ‘Version Report’ to our needs:
I tried to display not only the story points history and resolved, but also the story points in each (aggregated) status upon each day (ready, in progress, in testing,…).
So I basically aim at recreating the same measure as the native “Story Points Resolved” and “Story Points Closed”, but for each status… Once I’d have that, I can reuse the same “cumulative till today” method as shown in the version report… But I’m lacking that original measure and don’t know how to recreate it for my own statuses…
I’ve been tying to find my way around the issues history, story points history,… but to be honest, I’m just losing it and getting more and more confused…
Any help would be super welcome !
Thanks !
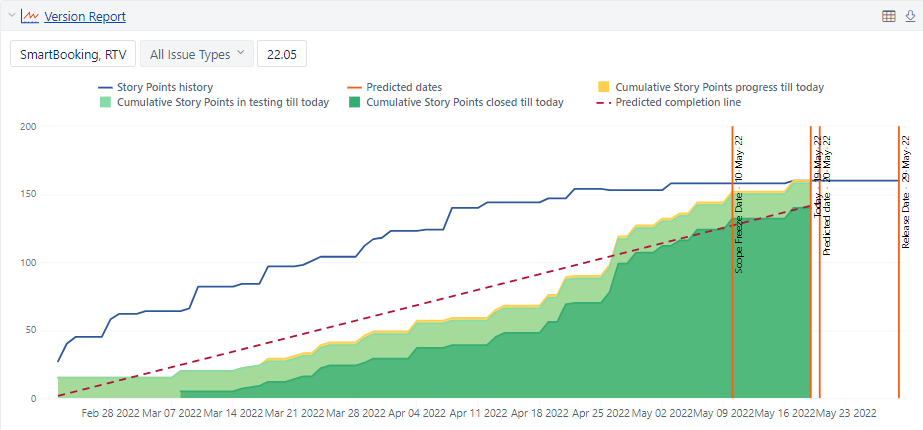
PS: You may think from the graph that I did get there, but you’ll notice if you pay attention that the “In testing” and “in progress” are in fact just a snapshot of story points in these statuses today,… then today’s values being applied across the graph… So definitely not reflecting the real history of each story (and its story points) transitioning over time from one status to the next…
hi, looks like I’m not having much success I was more optimistic when seeing the nice discussions on many other threads/requests… Did I do something wrong?
Ok my bad, meanwhile I did finally get to land on this one: Story Points by Status which pretty much answers my original request.
I do have another question that popped up since then though and remains unanswered:
On the same graph, you’ll notice the “Story Points History” curve, but I realized that this curve represents when the story itself was created, but doesn’t consider when the story was included/removed from the fixversion?
Concrete example: I have 2 months of development for my release, and I add a 10 SP ticket in scope in the middle of my release timeline;… but in fact that ticket was in the backlog (and estimated) for 6months already… On the graph, you won’t see a rise of 20 SP’s in the middle of the 2 months dev period as I would have expected/hoped… It’ll look like the ticket was in the release since the very beginning (based on the ticket&SP creation date). Would you see a way to change this?
Is the history of fixversion field value available? and if so, how to leverage it?
Sorry for the delay; the answer you found is what I would recommend for your use case.
You are right about the use of Story points history with the Fix version dimension. That is a limitation that eazyBI cannot track the change history for the multiple value fields. We currently do not see a feasible solution to implement the history tracking for such fields. So, your burndown chart shows only the changed story points for the stories currently in the Fix version.
A workaround might be to use a single select field for the burndown chart scope tracking instead of the Fix version (e.g., a single select custom field). This workaround cannot be applied in the past, however, but the story points history will be tracked entirely.