We are using the new measure ‘Xray Test Plan Overall Execution Status’ for test plans over views.
This measure is returning the results in this syntax. PASS: 1, TODO: 15, BLOCKED: 1 in one column only.
We need to separate it into columns to create charts from it. It means |1|15|1| (with removing the text pass, Todo, blocked…) instead of |PASS: 1, TODO: 15, BLOCKED: 1| (one column only)
We tried custom Javascript code and a bit of MDX for that but still won’t able to achieve the result we want.
Is there any support on this use case please from your side?
The Test Plan Overall Execution Status is pulled in as a property, showing a summary test count by each status as one field.
You might use a calculated measure to process the string of all statuses and represent them as separate columns.
In Measures, define a new calculated measure that would look up the status name matching the selected test run status in the report and find the following number of tests.
CASE WHEN --only when test run statuses in the report
  Not IsEmpty([Measures].[Xray Test Plan Overall Execution Status])
  AND [Xray Test Run Status].CurrentHierarchyMember.Level.Name = "Status"
THEN --find status in summary matching Test Run Status name extract number following status name
  Cast(
    ExtractString(
      [Measures].[Xray Test Plan Overall Execution Status],
      [Xray Test Run Status].CurrentMember.GetCaption||": ([^,]*)",1
  --set formatting to number so you could represent it in chart if needed
  ) AS NUMERIC)
ELSE --when no statuses selected show property as it is
  [Measures].[Xray Test Plan Overall Execution Status]
END
Select the new calculated measure to the report and choose to Drill into → the dimension “Xray Test Runs Status” (documentation on how to drill into measure by another dimension level).
Note that this approach works when you have individual Test plans on report rows because ‘Xray Test Plan Overall Execution Status’ is a test plan property, not a dynamically changing measure.
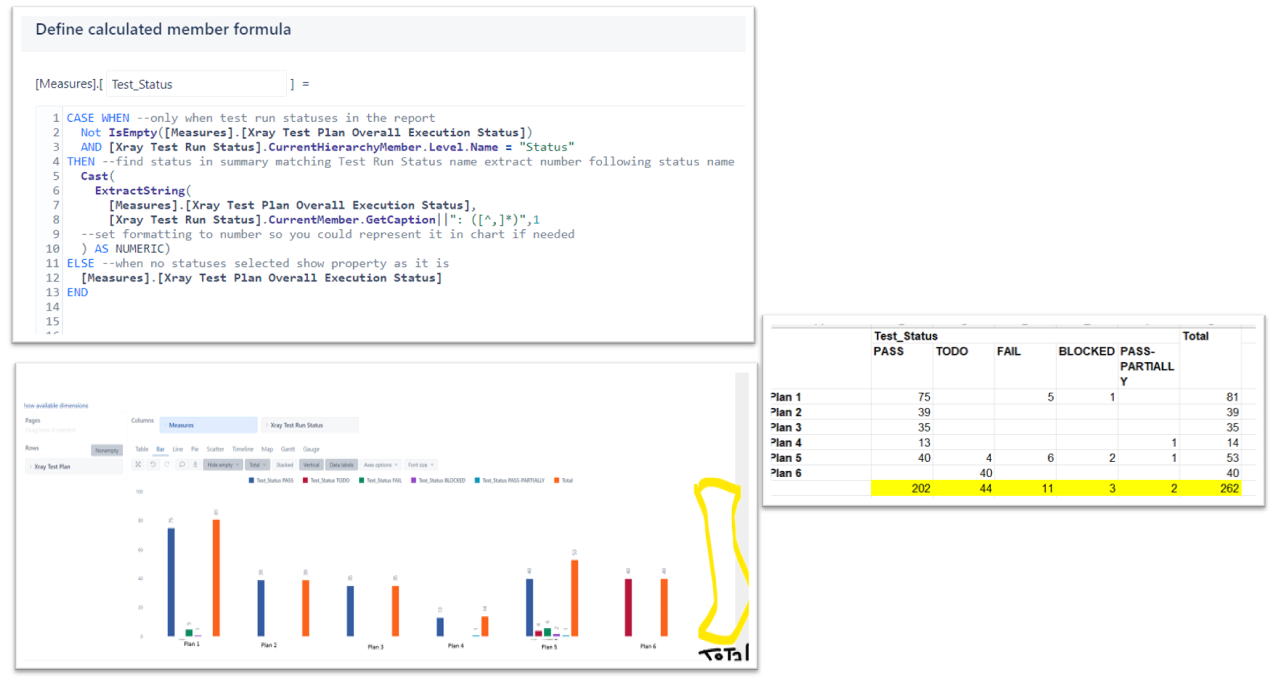
The report might look like this:
I want to thank you so much for the solution, because it is working really well.
However, when I want to add an additional dimension in Pages like the “Fix version” for e.g. or any other custom field the data isn’t filtered at all accordingly to that, and it shows all the same duplicated in every column, arent there any solution for this please?
The “Xray Test Plan Overall Execution Status” is a property, which is descriptive information and does not respond to any other dimension used in the report except for the dimension it describes (in this case, Xray Test Plan). The solution with calculated measure works only as prettify and splits the property value (String of statuses and test count) into separate items but does not add any additional logic to it.
If you would like to get execution results dynamically, then use Xray-specific measures.
Here are a few community posts you might find useful:
Hi @zane.baranovska and all,
I’m a fresher in these technologies, so please forgive me if I’m not precise in my terms. I have a requirement to display the latest status of tests for each plan, along with the total tests for each plan. I managed to achieve this result by using/modifying the portion of code you shared. However, I still need one more step, which is to obtain the totals for each column, but I’m missing the totals for each row to be displayed on the right side of the chart (highlighted in yellow as desired). Could you guide me on how to achieve this?
You can use the option Total row to sum up results across test plans on report rows (as you already have done).
Some rows or columns might be hidden from the report using Nonempy or hide empty options when using calculated measures that work with properties or change the context of predefined measures. In your case, the Toal row is hidden because of the “Hide empty row and columns” option. I need to do more checks to validate whether this is something eazyBI can improve.
Meanwhile, use only Hide empty rows for this report.
@zane.baranovska how do we filter test status from test plan for components that are attached to test cases. i created a custom filed with components but the components are showing only for test execution. how do we filter test cases that has components.