Can I show 2 Releases as one Gantt line (union or combined or stacked) ?
Hi @Sujith ,
To do this, you need to have min version start date and max release date from each of the release that are aggregated in Fix Version dimension.
Try using the Head() and Tail() functions to get the min and max values from Fix version. Have a look at the formula below for a similar use case where the max created date is retrieved from Fix version (for release the date is Release date):
Tail(
  Filter(
    Descendants([Fix Version].CurrentHierarchyMember,[Fix Version].[Version]),
    Not IsEmpty([Fix Version].CurrentHierarchyMember.Get('Start date'))
    AND
    [Measures].[Issues created] > 0
  ), 1
).Item(0).Get('Start date')
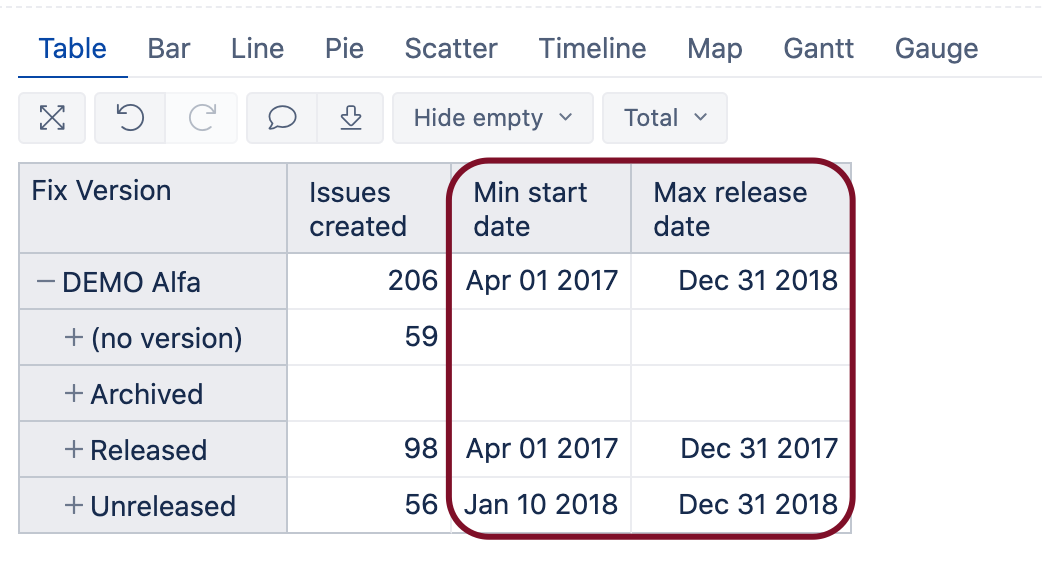
This is how is looks in report:
Here are some more examples from other posts:
best,
Gerda // support@eazyBI.com
Hi Gerda, Thanks for your suggestion.
I got min and max dates from head and tail, but how do I aggregate 2 Releases in one line … any help please
Hi @Sujith,
You need to create an aggregate in Fix version dimension:
Aggregate({
  [Fix Version].[Demo].[Unreleased].[1.0],
  [Fix Version].[Demo].[Unreleased].[2.0]
  })
Here you can see an example of how to do it: