Hello David,
eazyBI by default imports any numeric value as a measure you will get total value from this custom field. Histogram chart should represent a count of issues with particular numeric value and split by another dimension.
You would like to import your numeric custom field as a dimension or interval dimension into eazyBI to see how issues are split by particular values.
Here is an example custom field definition that enables importing this custom field as a dimension (interval dimension):
[jira.customfield_NNNNN]
data_type = "integer"
measure = true
dimension = true
intervals = "/10"
Please update the definition above using custom field ID instead of NNNNN.
The last line intervals = “/10” will create this dimension as an interval dimension with step 10. Please remove the line if you would like to split data by exact custom field values.
Please see more information about intervals though:
https://docs.eazybi.com/display/EAZYBI/Interval+dimensions
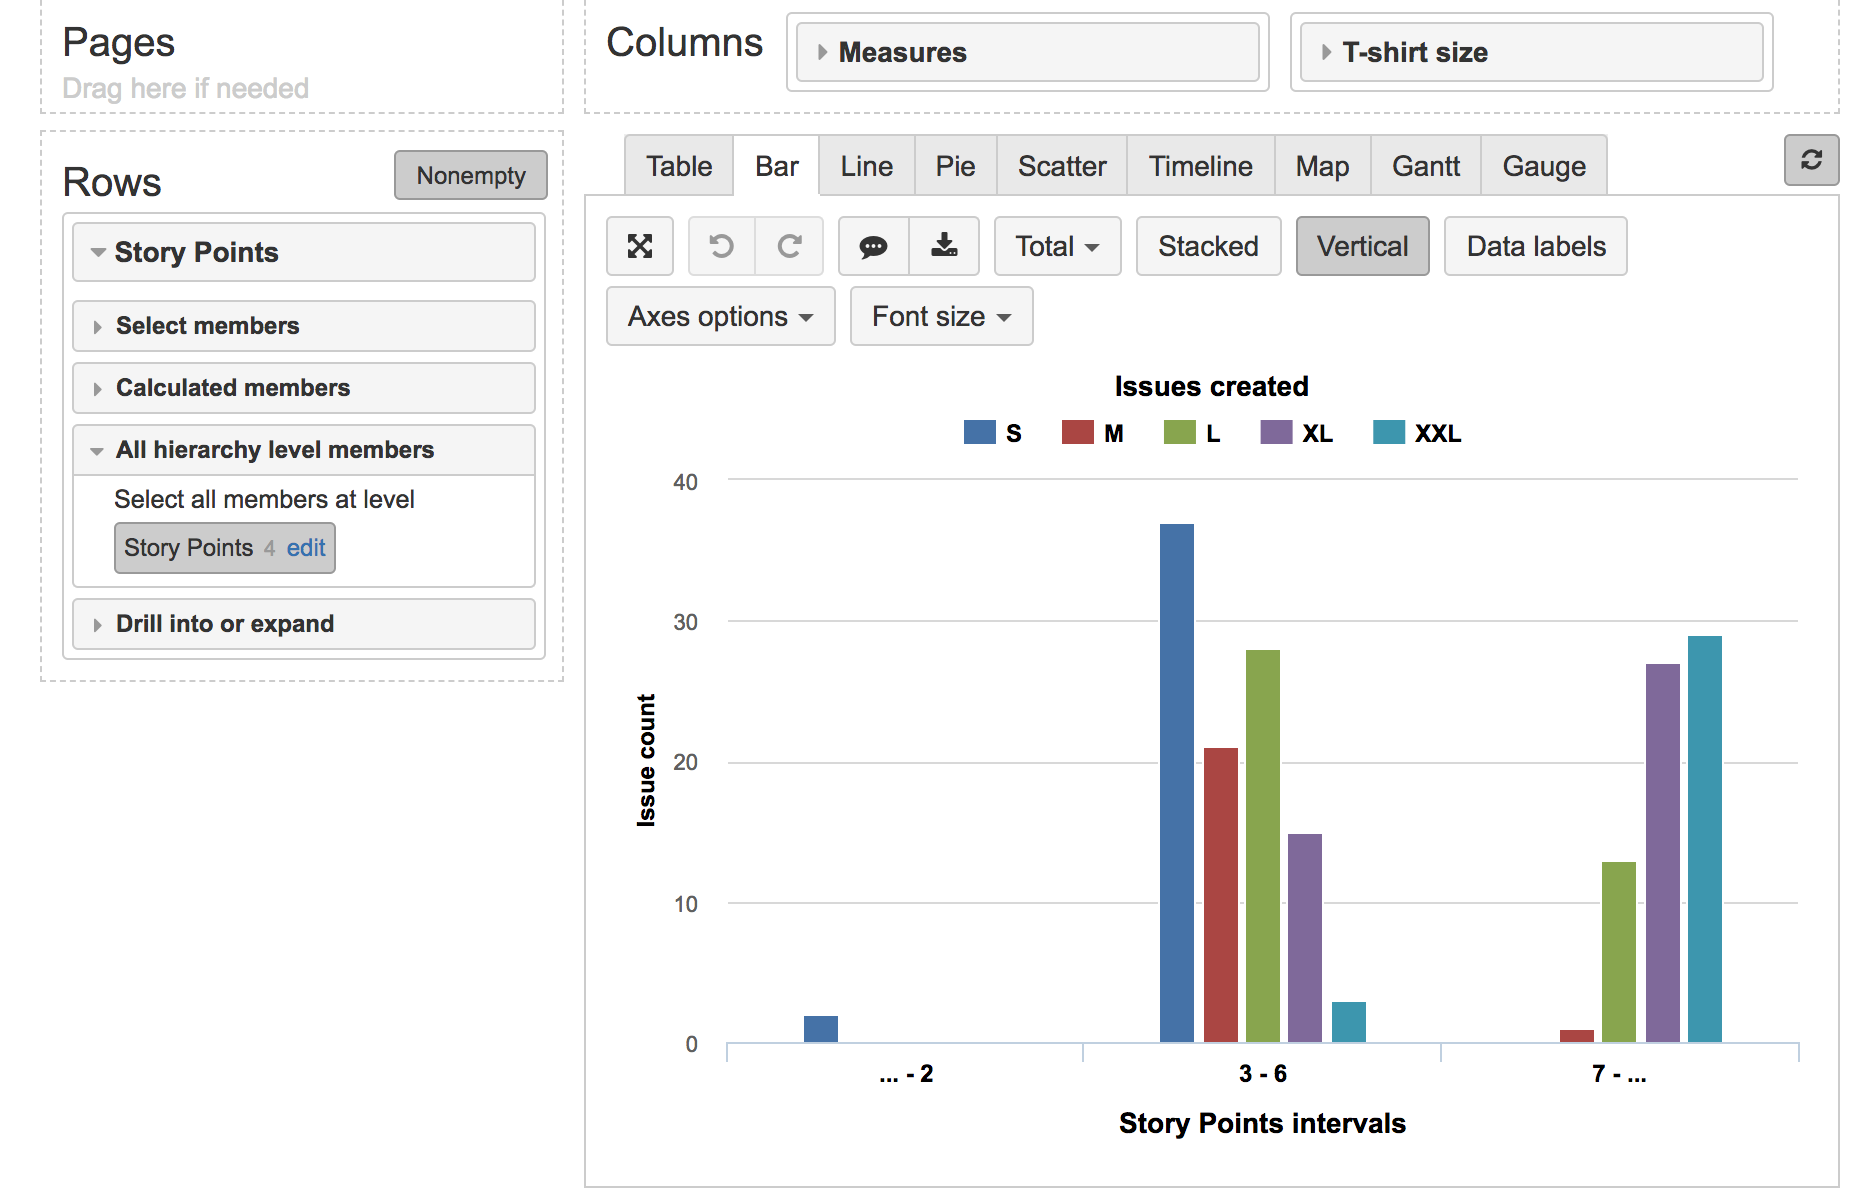
Then you can build a chart with this new numeric/interval dimension and your another dimension together with default measure Issues created. This will show you how issues are distributed by this numeric custom field and another custom field dimension.
In my example, I imported Story Points as interval dimension with step “3,7”. I used this new Story Points dimension and T-Shirt Size dimension to see a distribution of data.
Daina / support@eazybi.com