Resolved date based on the created date

Hi community

I am trying to build a chart that will display the follwing metric on a monthly level
Resolution Time: 85% in 15 calendars days/100% in 45 calendar days
This is what i did so far:

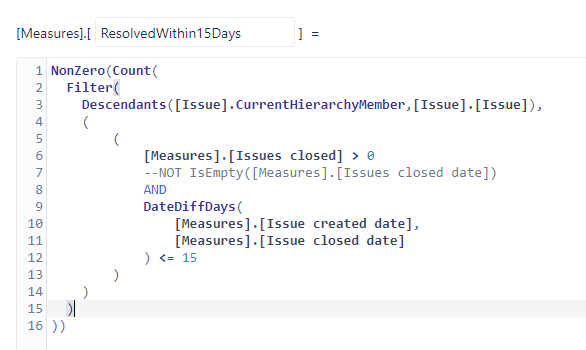
  1. Created two calculated fields to show how many tickets were reolved within 15 days (and 45)
    Screenshot_1

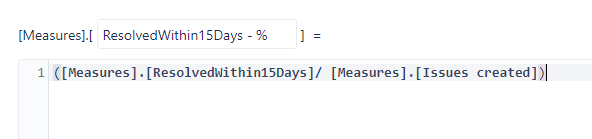
  2. Created a percentage calculated field that devides the field from point 1 by the items created
    Screenshot_2

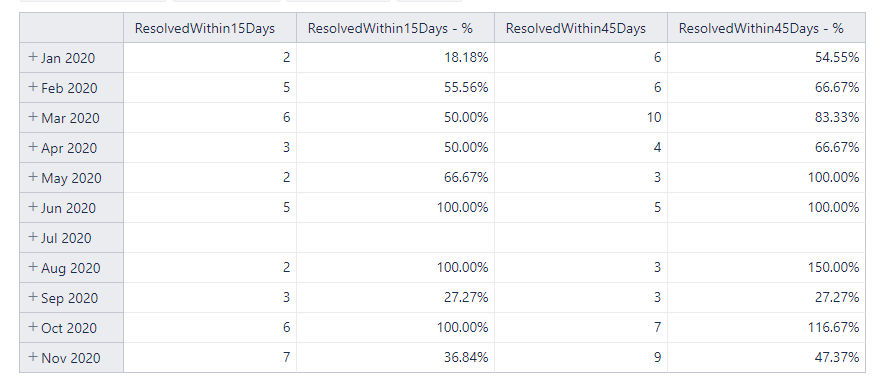
The problem i have is that an issue is with overlapping monts, meaning, if an issue was created in the end of November let’s say and was solved in the begining of December (meeting the “less than 15 days rule”), the cretaed will be marked in Nov while the reolved is Dec.
This creates some wierd values

Any idea how to improve my data?
Can the cound of the reolved be the created date somehow?

Hi @McKogan,
Welcome to the eazyBI community! :wave:

You can adjust your first formula, so it is grouped on Time dimension by the created date:

    NonZero(
  sum(
    Filter(
      Descendants([Issue].CurrentHierarchyMember, [Issue].[Issue]),
    Not IsEmpty([Measures].[Issue closed date])
    AND
    DateDiffDays(
      [Measures].[Issue created date],
      [Measures].[Issue closed date]
    ) <= 15 ),
    [Measures].[Issues created]
  )
)

Then the same grouping is used for your second formula:

With this, you should be able to avoid weird results, but let me know if you still encounter some problems!

best,
Gerda

Hi @gerda.grantina,

Can you please help me with the issue? I made changes as you suggested, but I am getting date format instead of counting issues. Can you please let me know what can be the issue? Thanks!
image

Hi @Jovanka_Jovicic
please check that you have set the measure formatting as #,### integer - Calculated measures

best,
Gerda

Thanks @gerda.grantina! How I get get data from created until resolved number of issues in time manner?

@Jovanka_Jovicic, you can use the predefined measure “Average resolution days” that will show the days between the issue created date and the resolution date.
See more measures here in the eazyBI documentation: Jira Core measures and dimensions

best,
Gerda // support@eazybi.com

Hi @gerda.grantina ,

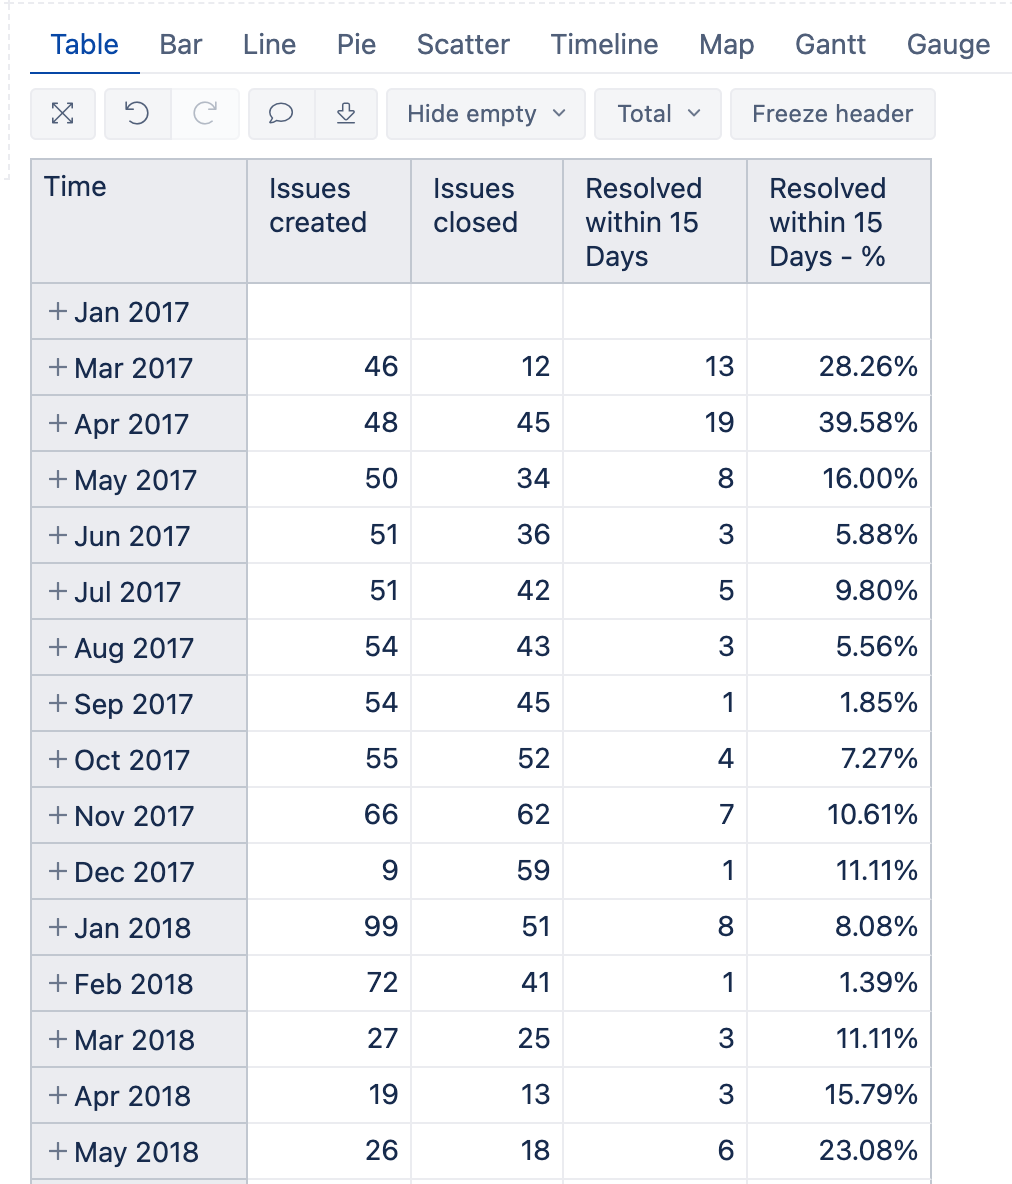
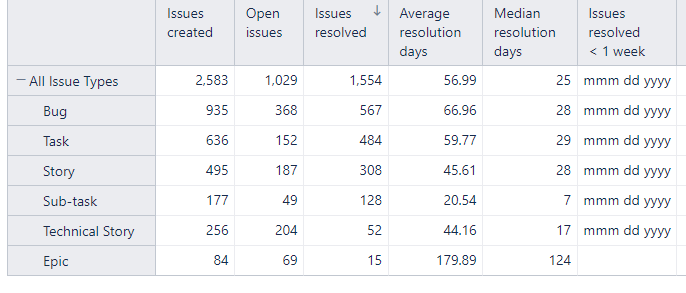
Thank you, I have created some overall overview that I need. What I am missing how to see number of issues resolved for example in 7, 10, 15 etc days? How to write those specifics? I am looking for a lead time from creation, until resolving. Thanks!

I tried with this:
NonZero(
Sum(
Filter(
Descendants([Issue].CurrentHierarchyMember, [Issue].[Issue]),
DateDiffDays(
[Measures].[Issue resolution date],
[Measures].[Issue created date]
) <= 7 AND
[Measures].[Issues resolved] > 0
),
[Measures].[Issues resolved]
)
)

But is it not correct, I took some epic random to check it is not calculating correctly :frowning:

image

Hi @Jovanka_Jovicic ,
The order in the function DateDiffDays() matters as the syntax for the function is DateDiffDays(from_date, to_date)

The first should be the “Issue created date” and then “Issue resolution date”.
Try this formula instead:

Sum(
  Filter(
    Descendants([Issue].CurrentHierarchyMember, [Issue].[Issue]),
      DateDiffDays(
      [Measures].[Issue created date],
      [Measures].[Issue resolution date]
      ) <= 7 AND
      [Measures].[Issues resolved] > 0
    ),
  [Measures].[Issues resolved]
)

best,
Gerda

Hi @gerda.grantina,

Thank you so much, I have nice report now :slight_smile: Regards,Jovanka

1 Like