Hi,
Am a newbie trying to learn EazyBi features.
Am trying to create cumulative timelines of 2 different projects to compare the trends.
In User-defined, we create 2 separate entries, with projects “ABC” and “XYZ”.
We could create sum of entries using below query.
Sum(
{
PreviousPeriods([Time].CurrentHierarchyMember),
[Time].CurrentHierarchyMember
},
NonZero(
Count(
Filter(
Descendants([Issue].CurrentHierarchyMember,[Issue].[Issue]),
[Measures].[Issues created] > 0 AND
(
[Measures].[Issue Platform] = “ABC”
)
)
))
)
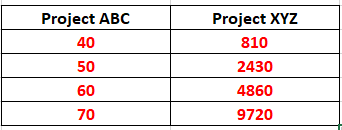
How to align , to show comparison of entries?
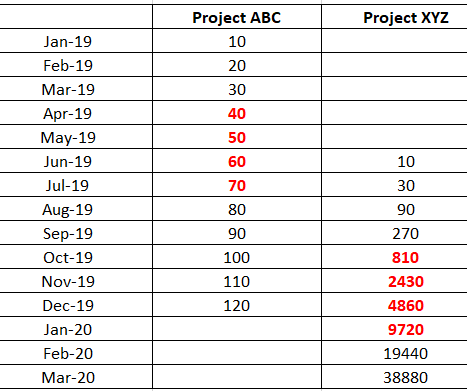
Comparison to be shown:
Thanks,
Vrukesh
Hi @vrukesh,
Please check out those Community posts where are solutions for such use case:
When you have created calculated measure to show created issues for both projects side by side aligned, then you might want to use a standard calculation to get accumulated value over time. Click on the column header and chose option Add calculated -> Cumulative sum. More details on this functionality are here:https://docs.eazybi.com/eazybijira/analyze-and-visualize/create-reports#Createreports-Addstandardcalculationsbasedonaselectedmeasure).
Best,
Zane / support@eazyBI.com
Hi Zane,
Those links look really helpful ! Will ping back, if we have any further queries.
Thanks,
Vrukesh