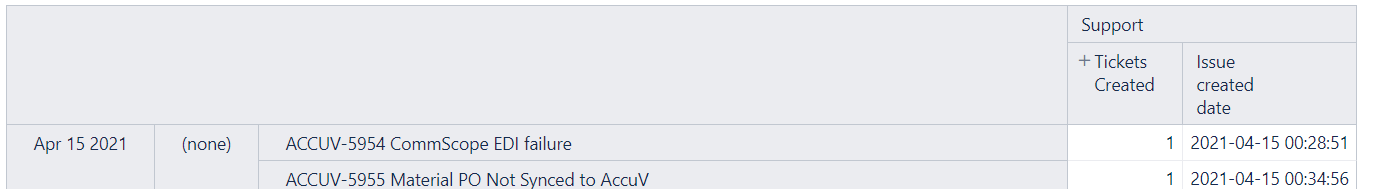
1.I would like to see a count of the number of issues created per day
2. I would like to see a graph that shows me an hourly breakdown (for the month) of the time of day tickets are created. (I am trying to determine when is the busiest time of day)
I am not having any luck creating either one of these.
For #1 I tried to use issues created count in combination with the issue create date measure and I am unable to figure out how to do this.
You can have the number of issues created per day by adding the Time dimension and expand all the members to the day level. The default measure Issues created is mapped to the time dimension by the issue creation date:
The solution for the hours’ breakdown would require the use of the advanced settings since the hour is not a standard dimension of the eazyBI data model.
You may try the following settings and import the Hour of Day Created field from the data import screen as a new dimension:
[jira.customfield_hour_of_day_created]
name = "Hour of Day Created"
data_type = "integer"
dimension = true
javascript_code = '''
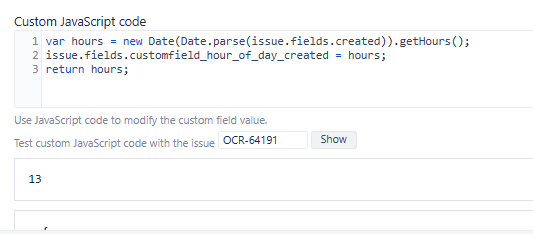
var hours = new Date(Date.parse(issue.fields.created)).getHours();
return hours;'''
Hi,
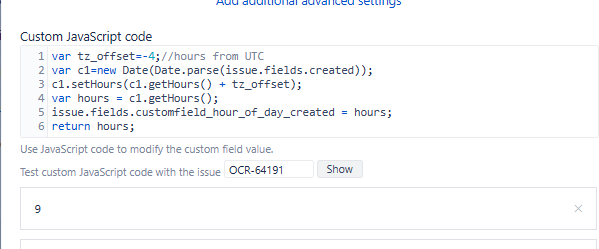
In the case of the eazyBI for Jira Cloud, you may need a different code with a hardcoded adjustment to the timezone offset:
javascript_code = '''
var tz_offset=-11;//hours from UTC
var c1=new Date(Date.parse(issue.fields.created));
c1.setHours(c1.getHours() + tz_offset);
var hours = c1.getHours();
issue.fields.customfield_hour_of_day_created = hours
'''
I’m not sure what I’m missing here, but I can’t seem to get this in place.
Am I supposed to create a custom Jira field named Hour of Day Created?
How will that help me with past tickets?
I’m not entirely new to Jira, but am new to EazyBI and it just feels like I’m missing something with this suggestion.
I figured out I need this in the Import portion of my Account Source Data, but I receive this error, “Execution of custom JavaScript code raised the following error:
unterminated string literal”
var tz_offset=-6;//hours from UTC
var c1=new Date(Date.parse(issue.fields.created));
c1.setHours(c1.getHours() + tz_offset);
var hours = c1.getHours();
issue.fields.customfield_hour_of_day_created = hours
Sorry I’m not a JavaScript guy, I ended up pasting the above only based on another Community post and it imported.
Where exactly did you use this Javascript in eazyBI?
Are you using it to define a new scripted field in advanced settings as this is the right and only place to paste this code when defining a new calculated field?
Once the field is defined in advanced settings you need to select and import it from the import options page.
Hey Martin,
I appreciate the response and opened a support ticket that helped point in the direction of our Jira allowlisting causing a potential problem. I’m receiving data now, but need to see if the report can be displayed the way we want.
We want it to show the number of tickets created per day per hour so we can track our busy times and shift our agent work times as necessary.
Any thoughts on that part?
-Devin
The offset by hours might mean that you have not applied the correct timezone offset in the Javascript code. Note that you might not see time in the Jira Server timezone once you filter issues in Jira if you have set the timezone in the user profile settings in Jira.
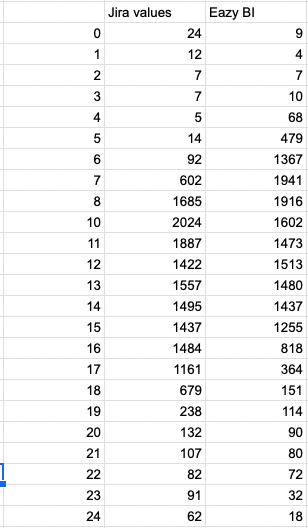
We need more details to check the reasons for missing issues. Please, apply to the support by providing the eazyBI Javascript custom field settings, report definition, and the filter by which you counted the issues in Jira.
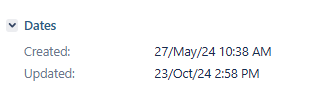
I found this post and it seemed it would resolve my issue, but I have problems with the time zone. Tickets are created in different time zones across Latin America, so, first thing is that I don’t know what time is showing on the ticket when I see it:
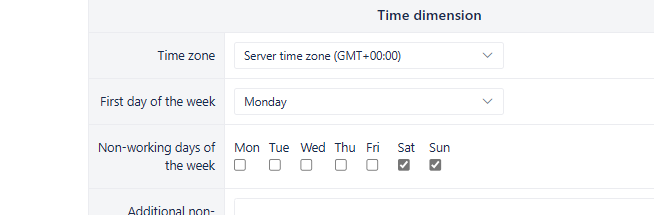
For the sake of discussion, let’s consider it is Santiago’s time zone. Import time zone for EazyBI is:
When I run the JS code with no TZ adjustment, there’s a + 3 hour difference
I used the modified version considering the Santiago Time Zone (GMT -4) but now difference is -1
Problem is Santiago has DST, so the code with the time zone adjustment would have to be changed every time the DST is on or off or is there any other way?
Jira should show the time by the time zone set in the user profile. All time fields users see in Jira should be converted from the server time zone to the timezone set for the user. This community post explains different aspects of the time zone settings: Issues with different update date.
You should change the Time zone setting in the eazyBI data import options to the same you set in your Jira user profile settings. The time should be imported into eazyBI the same way as you see it in Jira.
You should not need to use Javascript for such time zone conversion.