Review and download presentations from eazyBI Community Day 2019 in Las Vegas.
(Click on the image to open each presentation, click on the below link to download directly)
Day 1 Presentations
Latest eazyBI Features and Future Ideas
Raimonds Simanovskis – Founder & CEO of eazyBI, Latvia
Latest eazyBI features and hidden gems you did not know about. The past, the present, and the future of eazyBI – where have we been, where are we going, and what you can expect from eazyBI in a near future.
Presentation Slides

11-eazybi-community-days-2019-opening.pdf (4.1 MB)
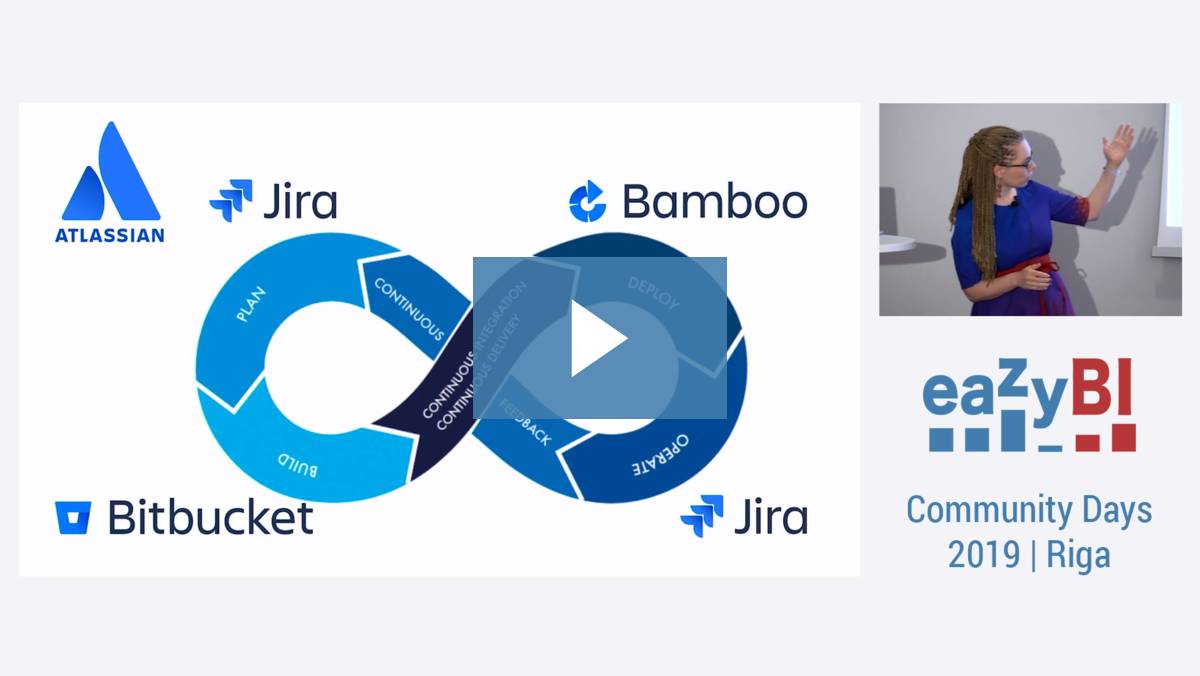
Add eazyBI to Your DevOps Tools Stack
Janis Baiža, Lauma Cīrule – eazyBI
DevOps mindset opens new possibilities for teams to improve productivity. eazyBI can assist you to measure and visualize quality of changes introduced when using Atlassian DevOps tools.
Presentation Slides
13-eazybi-devops-reporting.pdf (963.9 KB)
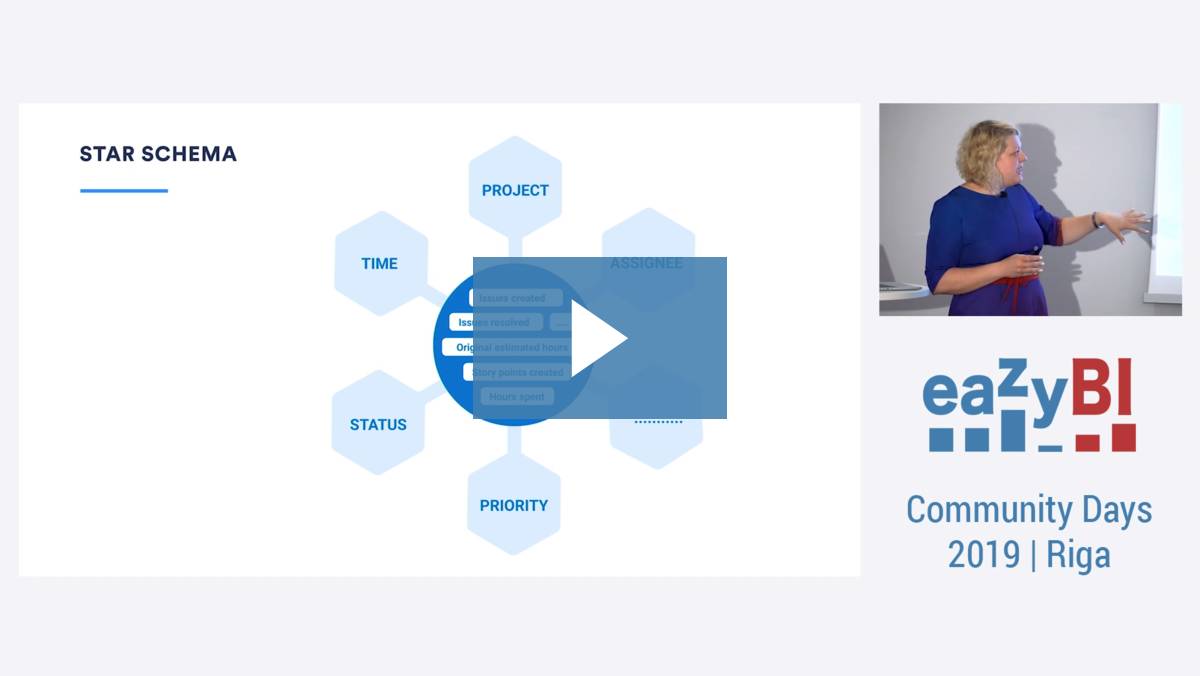
MDX ABC: Let’s Start at the Very Beginning
Ilze Leite-Apine – eazyBI
How to wrap a head around MDX calculations if you are not born as a programmer? Start by recognizing MDX building blocks — sets, expressions, aggregations and take time to understand eazyBI default measures.
Presentation Slides
14-mdx-abcs.pdf (2.6 MB)
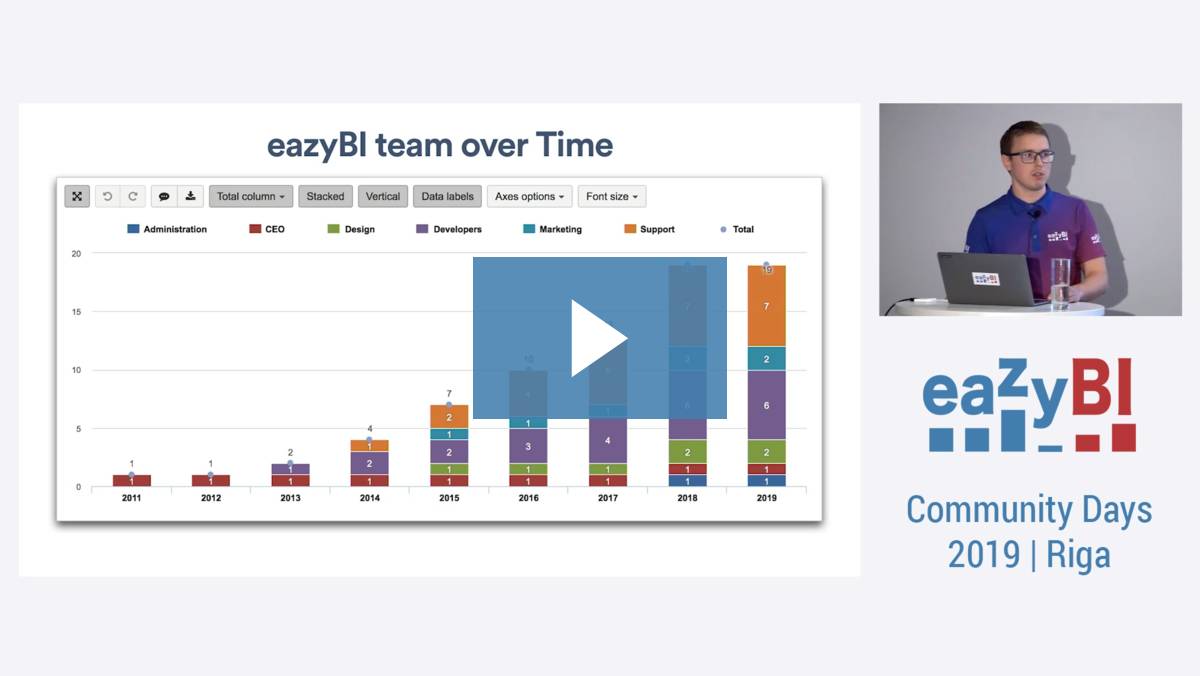
It’s About Time
Roberts Cāčus – eazyBI
Without time, everything would happen at once. Witness how you may integrate the Time dimension in your everyday reporting.
Presentation Slides
15-about-time.pdf (2.6 MB)
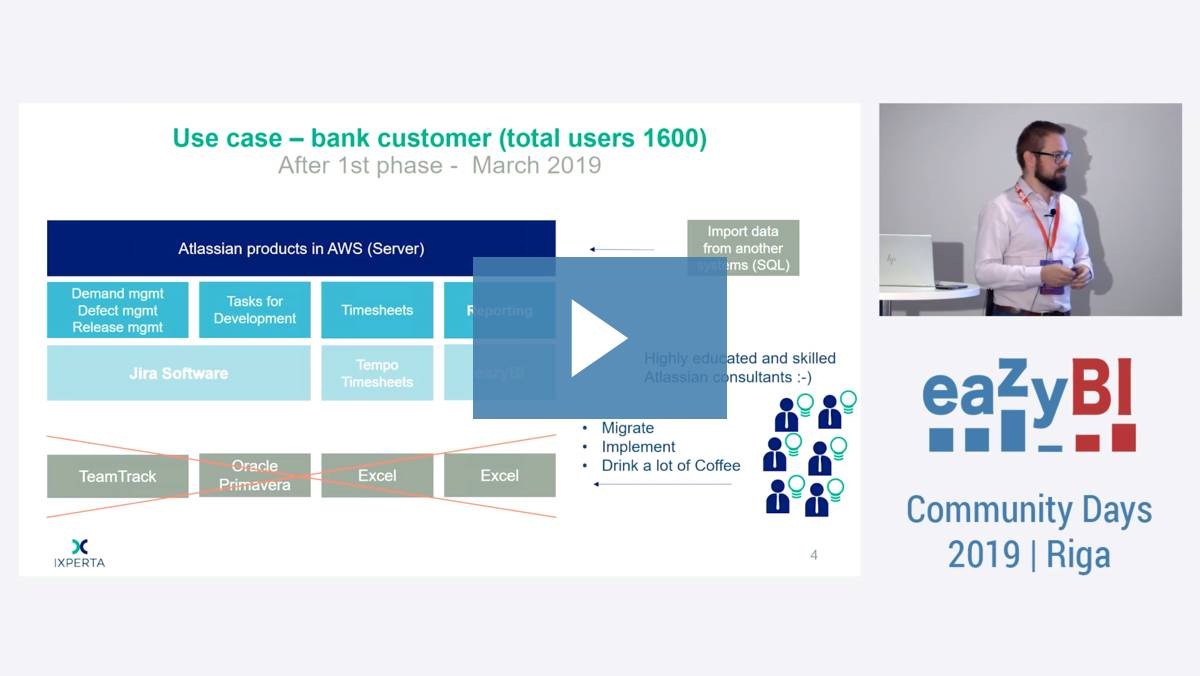
Tracking Costs in Real Time
Martin Kasik – Ixperta
You can have many data in Jira. But only their visualization can bring important and understandable information to the stakeholders. They can make quick decisions based on eazyBI reports.
Presentation Slides
16-ixperta-tracking-costs-in-real-time.pdf (646.2 KB)
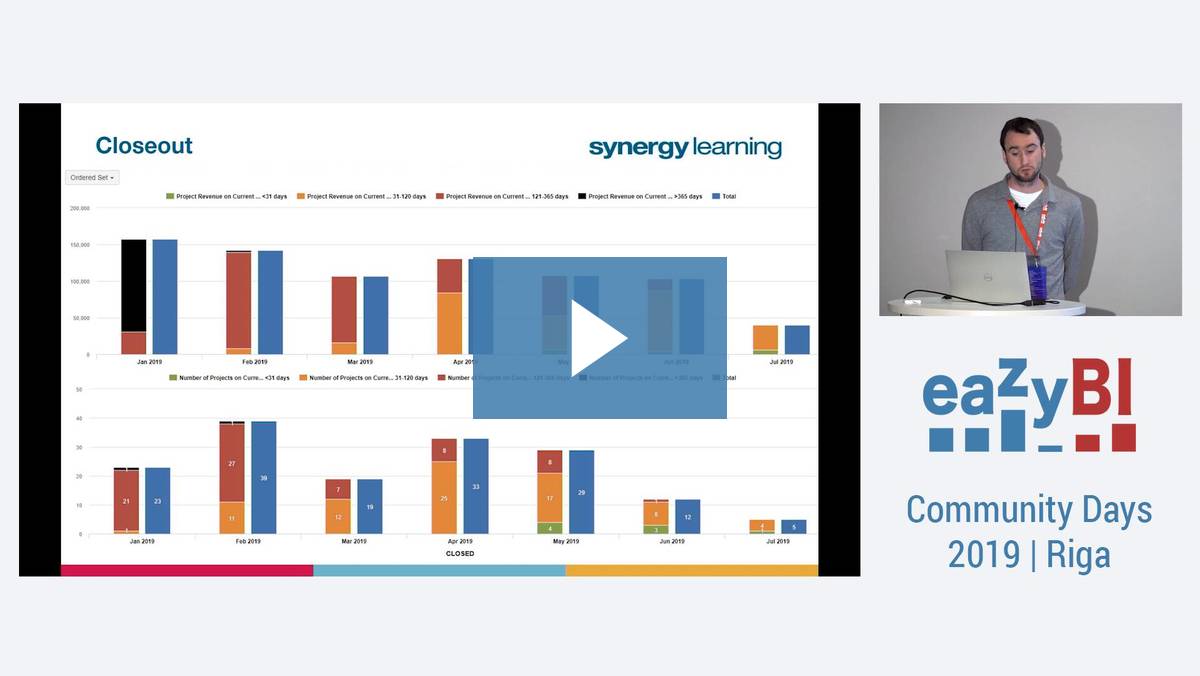
Project Reporting With eazyBI and Profields for Jira
Victor Lee - New Verve Consulting, Peter Hinds – Synergy Learning, United Kingdom
Profields enables enhanced project management in Jira via custom project fields. When combined with eazyBI, you can create powerful and insightful reporting for your PMO. In this talk, we run through our experiences in building integrated reports using data in Jira and Profields.
Presentation Slides

17-project-reporting-with-eazybi-and-profields-for-jira.pdf (604.1 KB)
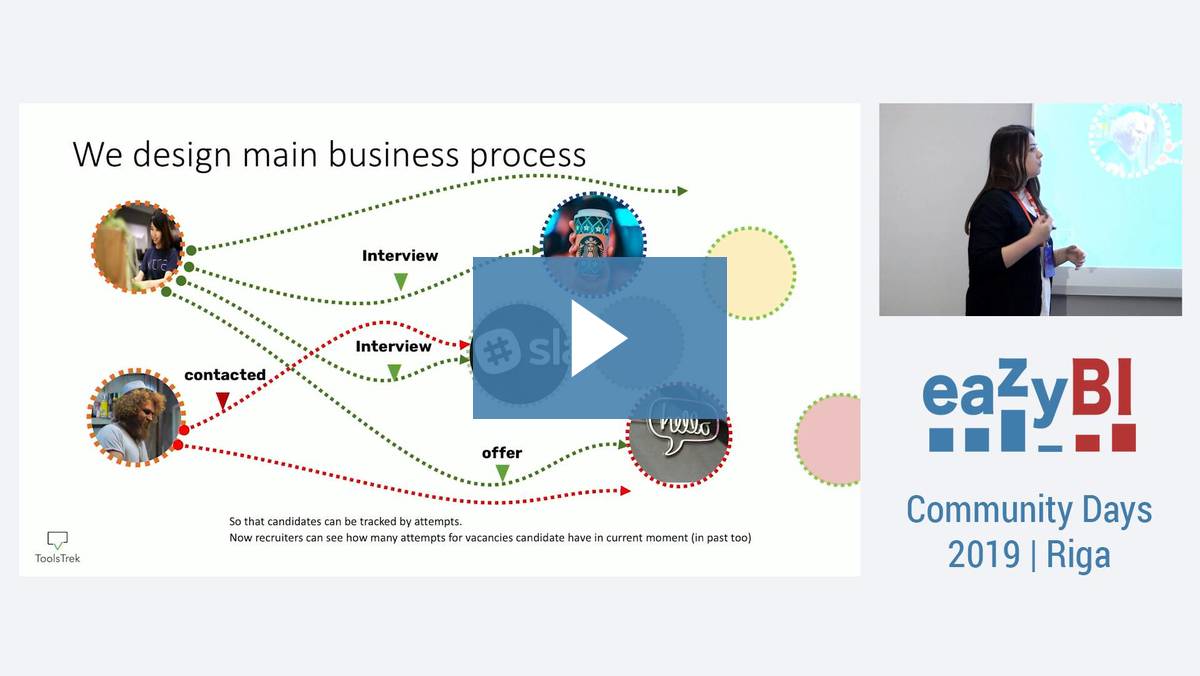
Reports that answer unasked questions
Olga Nikolaeva – ToolsTrek
In order to work effectively, we need to make decisions quickly. You can put strength on collecting the data needed to make a decision, or you can try to apply strength when designing the work process and create a report that will immediately help you understand what is happening. We will talk about one of our projects, on which we designed the work process and the report that allows you to immediately understand what is happening.
Presentation Slides
18-toolstrek-reports-that-answer-unasked-questions.pdf (342.8 KB)
Teams That Run Together Win Together
Ilze Leite-Apine eazyBI
While working fully remotely, we search for things that could bond us together as a team. We use the “Let’s try and then we’ll see” approach, and it is deliberating. It’s about small things that matter.

Presentation Slides

19-teams-that-run-together-win-together.pdf (6.7 MB)
Day 2 Presentations
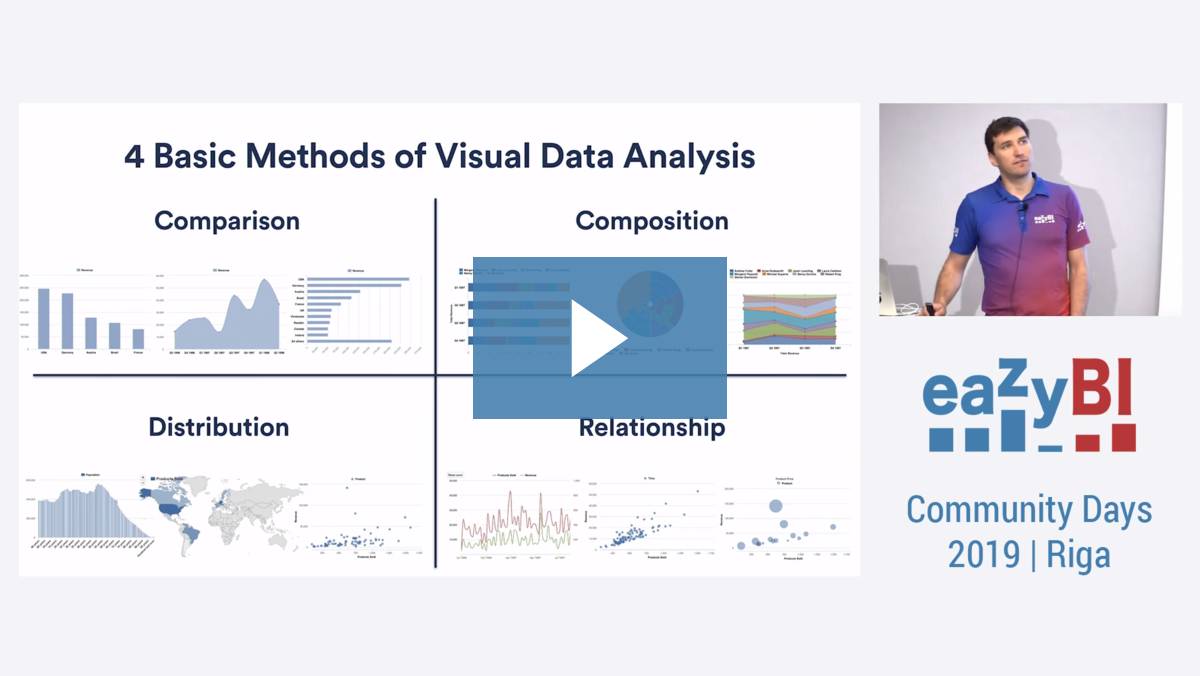
Do’s & Don’ts of Data Visualization
Jānis Gulbis eazyBI
How to turn your numbers into knowledge? Your job is not only to separate noise from the data, but also to present it the right way. How do you choose the right chart type and how to use different charts effectively? The do’s and don’ts or data visualization.
Presentation Slides
21-data-visualization.pdf (5.6 MB)
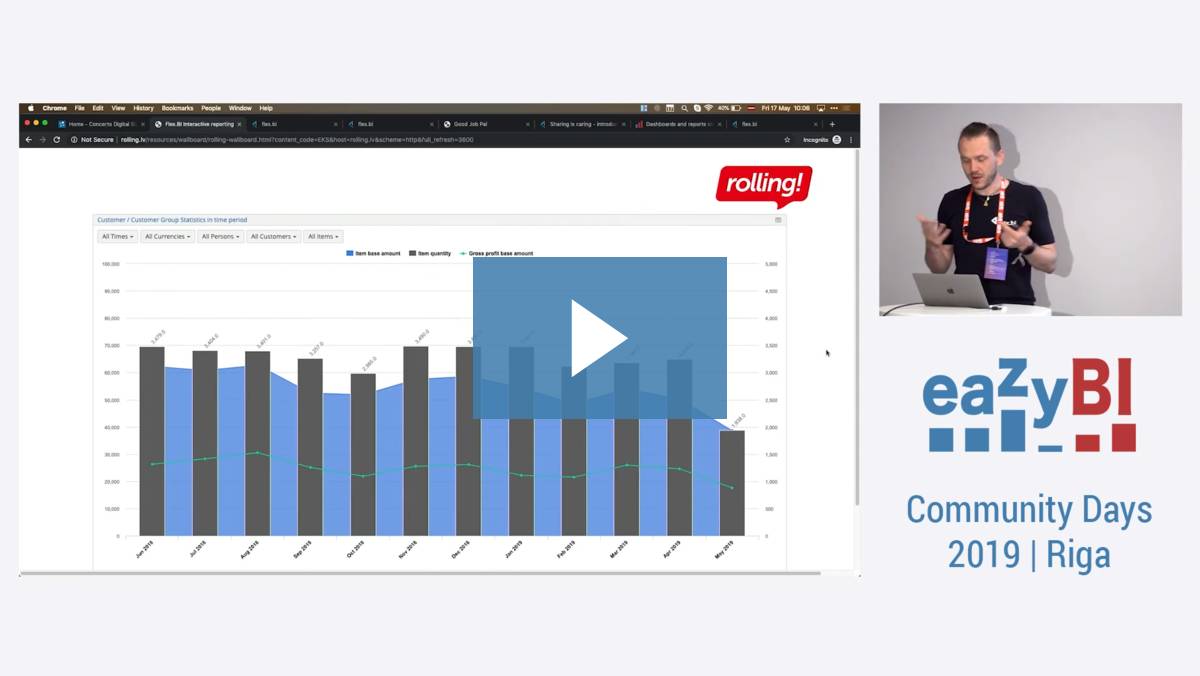
Best Use of Wallboards
Elvis Kvalbergs Flex.bi
Why do we need wallboards? What’s the purpose and benefit of sharing the information? Wallboard use-cases and best practices.
Presentation Slides

22-flex.bi-wallboards.pdf (1.0 MB)
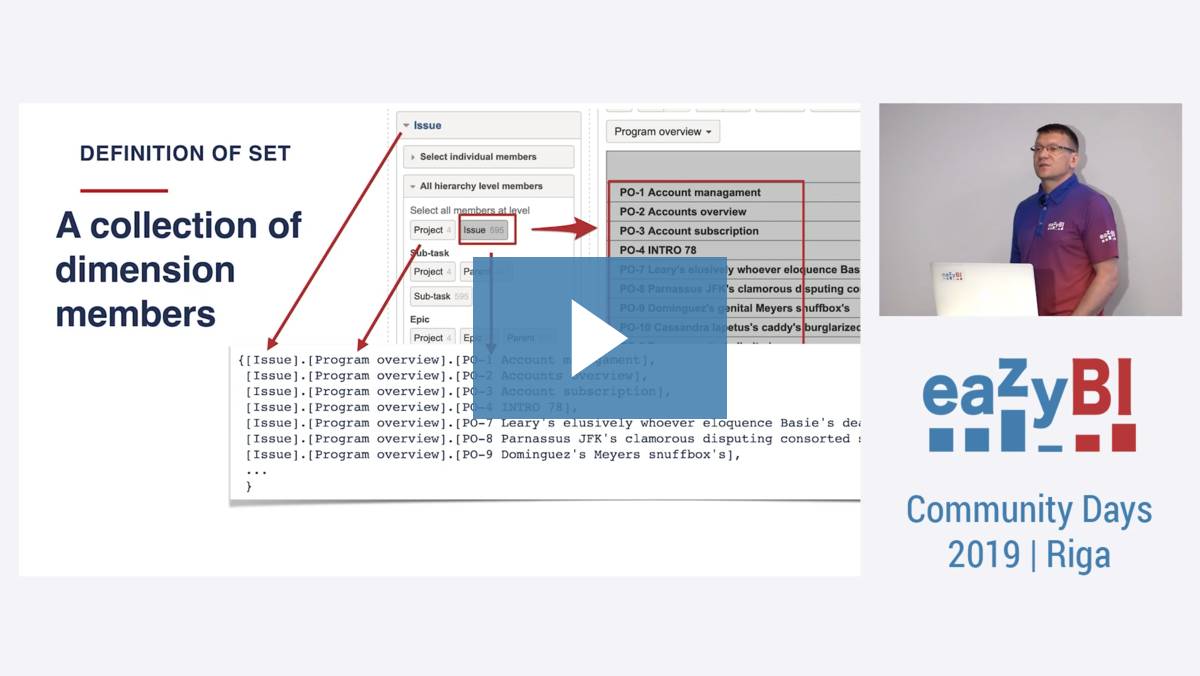
Handling Sets - Under the Hood of Calculated Members
Janis Plume eazyBI
Writing custom MDX calculations that work requires knowledge of basic concepts. A “SET” is one of them. Have you ever wondered what is inside the curly brackets, what means Members and Descendants ? The presentation will explain how to construct and use sets in MDX formulas.
Presentation Slides
23-handling-sets.pdf (1.2 MB)
Get eazyBI Accounts Back on Track
Daina Tupule, Zane Baranovska – eazyBI
How many accounts do you have? Are there too many or not enough? Right account setup is a cornerstone to get smooth reports for the right users. And did you know that you can analyze eazyBI with eazyBI?
Presentation Slides
24-eazybi-account-management.pdf (1.8 MB)
Understanding Tuples
Lauma Cīrule eazyBI
Tuple is one of calculated measure corner stones. What exactly is Tuple in multi dimensional cube? How and when to use tuples in MDX formulas? Come to see some real life examples in eazyBI.

Presentation Slides
25-understanding-tuples.pdf (740.1 KB)
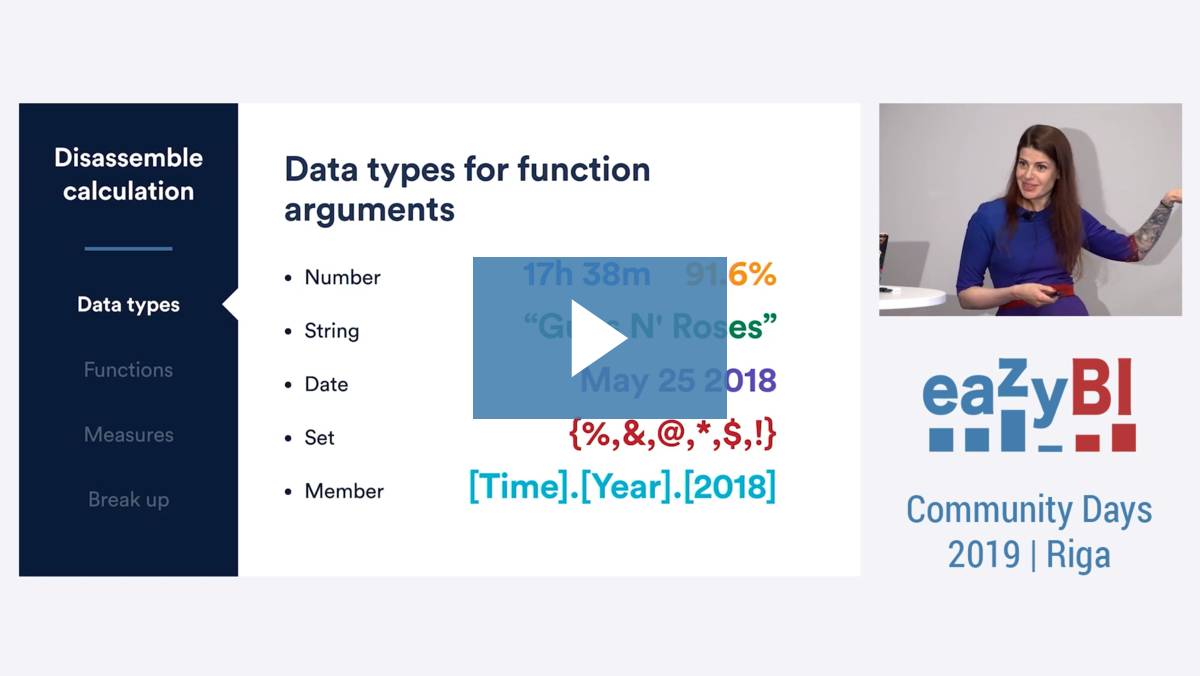
How to See Through Calculated Measure
Zane Baranovska eazyBI
Do you ever wonder how calculated measure works and gets to the result? You will learn principles on how to disassemble the calculation to see the results of each step and how to find a faulty part in a formula to fix it.
Presentation Slides
26-how-to-debug-mdx.pdf (1.9 MB)
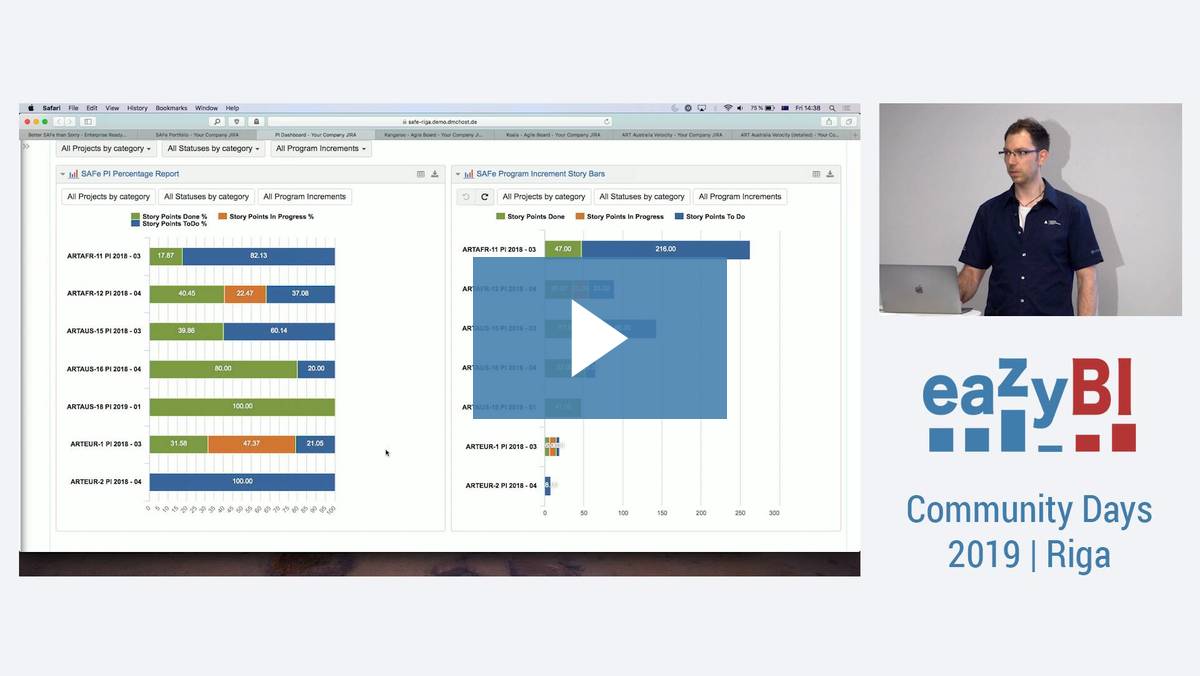
Better SAFe than Sorry - Enterprise Ready Reporting at Scale in Jira
Marten Thorand Technical Atlassian Consultant, demicon GmbH, Germany
Management-friendly reporting in Jira can be tricky. The built-in reports are great for teams, but usually insufficient for the management especially in big enterprises. How can you keep track of projects on portfolio level, risks, or even budget? We’ll show you how to get all the relevant reports in Jira and how that benefits the company.
Presentation Slides
27-demicon-better-SAFe-than-sorry-demicon.pdf (894.0 KB)
Why Sharing is Caring?
Mārtiņš Vanags eazyBI

From data dictatorship to data democracy — a path to take when you care about your team enough to put your efforts and share data within all your organization. In eazyBI, we are strong believers in open data and transparency.
Presentation Slides
28-why-sharing-is-caring.pdf (1.5 MB)